Showing posts with label markets. Show all posts

Thursday, April 30, 2026

Markets in April - Recovery & Retracement Levels

After the much maligned market performance in March, there was a swift recovery seen across the bourses in the month of April. However there is still a direction lacking whether market intends to go on the top side and break the all time highs or meander back towards the lowest point in early April and go down even further. 

April however didn't start off on the right footing. After one felt that the March lows of 22,283.85 would not be shaved off and be held strongly came a sharp fall on the Thursday of April 2nd 2026 when the Nifty slit through all the support levels and slipped to a new low of 22,182.55. Miraculously after falling almost 500 points from previous day (April 1st) closing of 22,679.40, the market suddenly much against all odds moved at a steroid pace to ace up 600 points on the same session to reach a day's high of 22,782.30 before finally settling in at 22,713.10 and end the day in the green. Similar scenes were witnessed in the Bank Nifty also as it broke even the barrier of 50,000 to hit an intraday low of 49,954.85 before making a rapid sharp upward detour to close in the green. The Bank Nifty had almost shed 12,000 points from its recent high of 61,764.85 leading to tank almost 20% before the recovery started rolling in.

The fall on that day was expected due to soaring geo political tensions but the recovery on the same day was pretty sensational. Another day in April which saw high momentum was on Wednesday April 8th when the markets shot up almost 900 points intraday to touch the landmark of 24,000 on the back of potential news flow relating to the end of the war. The first 5 sessions of Nifty all ended up in the green in April which was a welcome relief considering the immense slaughter which the markets underwent in March. The highest point reached in April was 24,601.70 leading to a rise of over 2400 points from the low made of 22,182.55. The last week in April saw some profit taking largely on account of impending tensions again starting to invigorate in relation to the war leading to higher crude oil prices and also the currency again shaving off it's gains. 

The Nifty finally ended it's mark on the 30th April at 23,997.55. Coincidentally on the 8th of April when the markets hit a euphoria due to news trickling in on account of the war supposedly ending, the close was at 23,997.35. There were over 15 sessions after that and the Nifty closed absolutely ditto flat with no change whatsoever to end the month at 23,997.55.

Thus, to summarise the month of April we can say that the start of the month was very positive but it tapered off as the month proceeded and toned down without really indicating a direction. There are still renewed hopes of a revival with the Strait of Hormuz expected to be opened anytime ultimately resulting in the war officially coming to an end. However alternative statements being carried out are also causing fear with crude oil once again surging well past the $100 per barrel towards end of April and even almost hitting close to $120 at one stage. Thus market still seems directionless without not knowing which side to navigate.

With markets closing out April correctly at the ball park of 24,000 it's kind of right in the middle point from the all time high of 26,373.20 and recent April low of 22,182.55. Markets have to fall around 1800 points or 7 and half percentage to breach the low point. For gaining ground to reach the all time high touched on January 2026, markets have to climb up about 2400 points or approximately 10% from the current mark of 24,000.

Lets look at the upsides to watch out for and downsides to safeguard for the Nifty

Nifty All Time High: 26,373.20

April Low (2nd April 2026): 22,182.55

Difference in Points: 4190.65


Levels on Upside:
23.6% Retracement: 23,181.55 (22,182.55 + 4190.65*23.6%)
38.2% Retracement: 23,783.35 (22,182.55 + 4190.65*38.2%)
50.0% Retracement: 24,277.85 (22,182.55 + 4190.65*50.0%)
61.8% Retracement: 24,772.35 (22,182.55 + 4190.65*61.8%) 
78.6% Retracement: 25,476.40 (22,182.55 + 4190.65*78.6%)
100.0% Retracement (Current All Time High): 26,373.20 (22,182.55+4190.65*100.0%)

Based upon April high registered of 24,601.70, Nifty already surpassed the 23.6%, 38.2% and 50.0% retracement levels and was well on course towards 24,800 levels which is the 61.8% retracement levels but however a sharp pull back towards the latter end of the trading month brought down Nifty just sub under 24,000 levels.

Levels on Downside:
- Current Low on April 2nd 2026: 22,182.55
- Psychological Barrier mark: 22,000.00
- Tariff Day Low Apr 7th 2025: (Previous 52 week low): 21,743.65
- General Election Results Day Low on Jun 4th 2024: 21,281.45
- Lowest point of year 2024 (24th Jan 2024 during Adani Saga): 21,137.20
- Bear Market Territory 20% downside from top: 21,098.60
- Close on the heels is next psychological figure of: 21,000.00

As of end April, Nifty is well above the low which it registered at the beginning of the month. However caution needs to be exercised since if the war crisis continues to elongate, it will result in excessive oil prices perhaps even breaking record all time highs. The Indian currency also has again gotten weaker again getting back to 95 levels and not too far from reaching the 3 figure mark. The foreign institutional sell flows also need to be curbed. If all of these continue to compound in the negative zone, it may just open up the flood gates for the markets to crate heavy holes on the downside. Last year the low was hit on April 2025 and this year so far the low has been hit in April 2026. We have to wait and watch the direction markets take and how things will eventually pan out.

Tuesday, March 31, 2026

Markets in March - Mayhem, Madness and Meltdown

The markets all over the globe have been bleeding heavily but it's been complete decimation in the Indian bourses. Ever since the news of the war, the markets have been falling relentlessly with no respite whatsoever. This is a bit disappointing considering that except Indian market, all other major markets did see a rise on the upside up until the news of the war. The market here had touched a gold standard mark of 26,277.35 in September 2024 and been meandering around the same levels for all of 2025 and taking 14 months to finally reclaim that mark only towards end of 2025 to be precise on 27th Nov 2025. 

Before coming to the denting impact of March 2026, briefly reprising the summary of events playing up until the news of the notorious war breaking out in order to map levels to see how much the central Nifty index has been put on brakes. After the high created on Sep 27th 2024 which was the figure of 26,277.35, the Nifty nosedived all the way to 21,743.65 on the 7th of April 2025 on the back of the hullabaloo caused by the news of tariff. That translated in a drop of over 4500 points (4533.70 exactly) shedding over 17% in the process.

However the index bounced back pretty sharply from there on to quickly gain lost ground though however getting back the All Time High value was still quite a task and it managed to finally get there around 8 months from that hollow point to take out the earlier high in end of 2025. Nifty registered a high of 26,325.80 on the 1st of December 2025 which was not even 50 points higher than previous high in Sep 2024 and kept chirping around the same levels without usurping for the whole of Dec 2025.

Finally during the first week of the month in 2026, Nifty finally scaled all time high again and reached a pivotal mark of 26,373.20 on 5th Jan 2026. This seemed like auspicious times were ahead especially with the central index hitting new high right at the beginning of the year. This high though incidentally wasn't even 100 points away from the highs made over 15 months back in Sep 2024 (26,277.35).

Normally when new highs are made after a prolonged time, you would normally see a euphoria effect giving it the pedal in gathering and gaining momentum to rise up much further. But sadly in the case of Nifty it didn't happen. After the sacrosanct point hit on 5th of Jan 2026, index was just lurking around this corner and in fact drifted down to hit a low of 24,571.75 on Budget Day Feb 1st 2026. This was a fall of 1800 points but however the markets protected that level and ensured it doesn't hit rock bottom any further. However the levels of 26,000 continued to elude and the markets closed the month of February 2026 on 25,178.65 which was off the highs by roughly 1200 points.

March witnessed a monumental rout with the news of the war being out on the last weekend of February. Right on the first session in March, the index slipped below 25,000 levels just barely protecting the Budget Day lows of 24,571. It didn't take long as just on the next session, that hold was tumbled and and in just couple of more sessions the mark of 24,000 was eviscerated. The madness didn't just stop at the 23,000 levels as by mid of March, Nifty even slipped below that to hit the 22,000 range. From touching a low of 22,930.35 on 19th March, it rebounded again beyond 23,000 again only to be sold into heavily breaking even the 22,500 barrier to register a new low of 22,471.25 on the 23rd of March 2026. There was a small internal bounce immediately with Nifty capturing almost 1000 points very soon to touch a high of 23,465.35 on 25th March but a disastrous Friday of 27th March yielded Nifty to again fall below the 23000 mark to levels of 22,800 though slightly higher than the lowest levels of 22,471.25. And then finally on the last session of the month on 30th March, that level was sliced nonchalantly like a knife on butter falling much below to register an intraday low of 22,283.85 before finally closing proceedings of this wretched month at 22,331.40.

March has been a month laden with madness a plenty. From starting the month above 25,000 levels (25,178.65), it has hit a low of 22,283.85 shedding almost 3000 points off the table. Considering the recent all time high of 26,373.20 on 5th Jan 2026, the fall has now mounted to over 4000 points (4089.35 points). There were many significant down days in this month with single sessions chopping off well in excess of over 300 points which didn't even seem like a misnomer and felt like a regular occurrence. The huge gap downs almost regularly was really daunting. Listing briefly the tormenting days in March which saw the Nifty bleed mercilessly. 10 of the 19 sessions in March 2026 saw a bludgeon in extravagance of 300 points in a single day's trade.

- Monday 2nd March - 312.95 points
- Wednesday 4th March - 385.20 points
- Friday 6th March - 315.45 points
- Monday 9th March - 422.40 points
- Wednesday 11th March - 394.75 points
- Friday 13th March - 488.05 points
- Thursday 19th March - 775.65 points
- Monday 23rd March - 601.85 points
- Friday 27th March - 486.85 points
- Monday 30th March - 488.20 points

Thus, from the above it's easily decodable that 10 of the sessions has yielded cuts in excess of 300 points on a single day and it's only been intensifying further along the way. It's been such a brutal month tainted with shocks aplenty almost on an everyday basis. You will seldom see such violent moves on an everyday basis but that was literally the scene all through March. In the 19 sessions at play in the month of March, there was a movement of 1% or more on almost every single session which was truly unprecedented. There were however 2 back to back sessions of the index also registering plus 400 points each on both 24th and 25th March on account of war tension slightly easing but it was short lived as the Friday on 27th after the holiday on Thursday saw a dramatic down side. On the whole it's been a very painful month for the markets and to accentuate matters further the series of gap downs being completely destructive affecting traders at large and also seeing holes on the investor portfolio.

There are 3 major reasons plaguing Nifty at the moment. One factor being the Indian currency being one of the worst performing currencies shedding oodles of value against the dollar, second being the imminent increase of crude prices due to the ongoing war crisis which has witnessed a sharp uptick in the crude commodity. India being a huge net importer of Crude is deeply under the pump due to this. Thirdly and most importantly from a market stand point is the excessive outflow of funds by Foreign Institutional Investors. They have been selling relentlessly with March seeing a selling figure in excess of a Lakh of crores which is one of the highest ever outgo in the history of Indian stock markets. All these 3 are worrying signs and of course the underlying war situation and company earnings also will have a bearing. But to stem the rot, these 3 factors need some easing out if the markets have to inch up higher.

Dollar - Reached highest ever peak of $95+ in March

Crude - Brent touched a high of $120 and is the highest ever since 2022

FII Selling - Touched monumental high of over 1 Lakh crores. Highest single month selling in history of over one lakh twenty thousand crores that translates to an average outgo of +6000 crores per session

Let's take a look at some of the levels to watch out which Nifty needs to protect and hold on to march forward. The All Time High is 26,373.20. The lowest point hit in March is 22,283.85. The next support is only at the psychological figure of 22,000. If that slips then levels of 21,743.65 will come into play which is the 52 week low of Nifty that it hit in April 2025 on the back of the tariff news. Next protection will be the mark of 21,281.45 which was where Nifty headed on the day of the result of the Lok Sabha elections on 4th June 2024. Following this would be the lowest point of 2024 which was 21137.20 hit in early part of 2024 and closely on heels is the mark of around 21100 (21098) meaning Nifty would have shed 20% off it's recent highs and finally the ballpark number of 21000. If by chance Nifty slips below 21000, huge panic would be ignited as it will be trailing at a 3 year low giving the bonkers to all investors and mutual fund holders that use the SIP platform to invest. Sharing a summarised view of the levels below.

All Time Highs - 26373.20

March Low - 22,283.85

Levels on Downside:
- Psychological Barrier of 22,000.00
- Tariff Day Low Apr 7th 2025 - 21,743.65
- Election Results Day Low Jun 4th 2024 - 21,281.45
- Lowest point of 2024 - 21,137.20
- Bear Market Territory 20% downside - 21,098.60
- Finally closing on is figure of 21,000

Nifty needs to act smart and make sure it protects the 22,000 levels which is the immediate hurdle. There is a high likelihood of getting there if the war tension doesn't recede. Let's hope the bottom is near and Nifty gets back on track. Getting back past glory levels is certainly going to take time considering the inherent implications but at least for the immediate set up Nifty should ensure as to not keeping on breaking lows on an everyday basis. What will eventually happen will only be decided by the outcome of the markets. For now it's wait and watch.

March 2026 will go down as one of the worst months ever in the history of Indian stock market. It's easily the most burning as exactly 6 years prior in March 2020 was when the impact of Covid hit the world at large with stocks all over the globe falling like nine pins gashing leaks across from all directions. A lot of events in March 2026 happened to be eerily similar as even some of the heavy down days matched with exact dates as of March 2020 which was pretty spooky to say the least. March 2026 has been a month of mayhem, madness and meltdown akin to the larger fiasco that took place in March 2020. Let's hope the situation only gets better from here on in and will see how the Nifty shapes up going forward.

Wednesday, April 30, 2025

Nifty 50's April Acrobatics - Taking everyone for a ride

The month of April has been a watershed month for the Indian markets. The moves that usually get witnessed over a year's time has seen it all play out just in this month of April. The volatility in the Indian markets have been kind of replicated by markets all over the globe but the Indian indices have been special in the sense that they started running up immediately after being bruised & battered which has not exactly been the case with the markets worldwide. The recovery has been truly unprecedented considering how languishing at the bottom the Indian benchmark index was for months on the trot.

After 5 months of continuous down run witnessed from Oct'24 to Feb'25, the month of March saw a turn in direction with the Nifty finally closing positive in the 6th month running. March too didn't begin well as the Nifty finally broke the resistance of 22,000 which it was holding tightly for dear life. It touched an intra day low of 21,964.60 on the 4th of March and from there on it was a stellar run and not even once was 22,000 breached again after that session. In fact Nifty raced well past 23,000 to reach a high of 23,869.60 on the 25th March before tapering off a bit to close the month at 23,519.35 on the 28th of March. 29th March was a national holiday and 30th/31st happened to be the weekend. Thus it felt that Nifty had finally broken the shackles after 5 continuous months of down performance and March was indeed very welcoming for the Indian bourses. It also kind of signalled that the low point of sub 22,000 wouldn't be reached again for this year especially on the back of a very strong closing in March well above 23,500.

However what April taught is never speak too soon and never come to any conclusions especially when it comes to the Indian markets. Markets have their own plans which no market mogul is ever able to predict and always plays it's own tricks and games which seems beyond the realms of comprehension of the common market expert. When April was expected to be a month of consolidation and slowly build on to the gains of March, it just took it's own juxtaposed jump in a convoluted direction doing all sorts of crazy things which only the markets can think of doing.

Early in the month of April, President Donald Trump announced tariff measures extorting high import duties on all countries and India wasn't spared from the list. Markets nosedived to cave beyond imagination. The damage was extremely severe on the US markets but all markets unanimously followed suit crating big time. That holy grail figure of 21,964.60 was taken out in a whimper with Nifty registering a newer low of 21,743.65 on the 7th of April. This was unimaginable as the markets started the month well over 23,500 and to fall about 1800 points in a jiffy was unfathomable. It was destruction of the highest order with stocks tumbling and taking a beating black & blue. It seemed like the worst was upon us. And then miraculously everything changed within a blink of an eyelid. From the bottom on 7th April, Nifty recovered a fair bit to close above the mark of 22,000 on the very same session and then for the whole month not even once was 22,000 tested again. In a week's time on 15th April the mark of 23,000 was taken out and the adrenaline rush didn't end here as another coveted landmark of 24,000 was broken with authority on the 21st of April. The Nifty went up all the way till 24,457.65 on the 29th of April and finally ended the month on the 30th of April by closing out at 24,334.20.

When one compares the end of March with end of April, an 800 point uptick was all that was noticed which appears to be very normal. But the pandemonium caused due to the extreme wild swings is what makes April a month to remember at the bourses. Opening at 23,500 levels it went all the way down to 21,700 levels shedding 1800 points only to bounce back like a tornado all the way up to 24,400 levels gaining 2700 points before finally closing the month at sub 24,300 levels. The difference between the lowest and highest point on the Nifty was a whopping 2714 points. The whole seesaw from low to high happened in a matter of just 14 sessions causing turbulence of the highest kind. With all the carnage unravelling within the first week of April, it looked like March was just an aberration and a repeat of the downward pattern prior to March seemed imminent with 1800 points taken out. And then to rise like a phoenix 2700 points from the bottom was simply unimaginable taking the total swing for the month to a colossal 4500 points. The Nifty 50 index virtually swayed, slipped, swung, somersaulted, swash buckled, steamrolled and switched salvo in what turned out to be an unparalleled month of April.

At the end of April, just a reaction of Phew! would be voiced out by all and sundry at the markets. It was a roller-coaster of epic proportions. At this juncture with the Nifty acquiring over 2500 points from the lowest point of 21,743.65 it may look like a retest of the recent lows is completely out of the woods but you never ever can vouch with certainty especially with this kind of maniacal market moves. At least for now it seems as if the worst is behind us. There is still 8 months remaining this year to see if Nifty can reclaim it's all time high of 26,277.35 registered on 27th Sep 2024. As of now it's just a trickle under 2000 points but the way markets are making all these zigzag patterns it's never easy to say what exactly will pan out. Until then let's just put on our buckle and enjoy this crazy wild joy ride and keep expecting the unexpected as the markets continue to do their thing!

Wednesday, March 5, 2025

Decoding Nifty Lows and Levels to Track

2025 has begun on an extremely sombre note for the Indian markets with stocks getting battered and bruised brutally. The pain for the large caps have gotten extensive whereas the Mid Caps and Small Caps have got a pounding pummelling. Investor sentiments have been dented severely and even a recovery may not help in confidence getting restored. The reason is because the fall happens to be a little too hard to digest because just months ago Nifty was scaling new peaks with market moguls shouting to the rooftops about this being a simply unstoppable euphoric wave only for it to dissipate almost beyond repair just few months down the line.

The Indian markets always tend to show extreme frenziness both on the upside as well as downside. When the ride was smooth, it appeared as the markets were heading towards uncharted territories with reality of even a Nifty 30,000 and Sensex 100,000 not really expected to be a distant dream. At the same time the way it has plummeted much against the tide despite the global markets largely staying put tends to defy logic. But that's the way it is and the Indian markets have always been known to make drastic moves with induced volatility and heightened unpredictability.

Coming to the actual indices points equation, the way as it stands today as of end February is that Nifty is just within striking distance of breaking the 22,000 barrier. In fact on 4th March 2025, it has even slipped below the 22,000 mark registering a new low of 21,964.60. Nifty 50 has completed a fall of well over 4,000 points from the time it registered it's record high of 26,277.35 on the 27th of September 2024. The large caps have been hit no doubt but the pain in the broader market has been even more unrelenting and unending. Falls are part and parcel of the game but one feels this is being overdone.

It would be good to analyse few data points with respect to the Nifty pattern since the beginning of 2024. The year 2024 in general was a good year for the Nifty 50 index except for the last quarter of the year when the correction started setting afoot. It was the year 2024 when Nifty hit plenty of 1000 point milestones with the landmarks of 22000, 23000, 24000, 25000 and 26,000 all being breached. All these however happened within the first 9 months of the year from Jan to Sep. October was a watershed moment with record selling by the FIIs making the Nifty to cart and since then it's been one way street downhill which has only extended much into 2025.

One important point to note is that in 2024, despite Nifty 50 constantly hitting new peaks and milestones, it always got pulled back within a short span of time only to retrace back and reach newer heights. This was pretty much evident especially in the first 3 quarters of the year. After the election results, Nifty saw a major wave on the upside reaching the magical mark of 26,277.35 in September end and after that started tanking with 5 straight months of fall from Oct'24 to Feb'25 which is the first time it has happened in 29 years since it's inception in 1996. 

Let's briefly look at the dilly dally pattern affiliated with Nifty in the first 3 quarters of 2024 from Jan 2024 to Sep 2024

Jan 2024:
15th Jan,  Nifty scales a new peak of 22,115
29th Jan, Nifty gets pulled back to 21,433
Difference 682 points

Feb 2024:
2nd Feb, Nifty again forges ahead to hit new lifetime high of 22,126
14th Feb, Within less than a fortnight tanks again to hit a low of 21,543
Difference 583 points 

Mar 2024:
11th Mar, Nifty comes back hard to register another new high of 22,526
20th Mar, In just about a week Nifty gets backtracked sharply and falls to a low of 21,710
Difference 816 points 

Apr 2024:
10th Apr, Nifty again on the attack usurping it's previous high to reach new summit of 22,775
19th Apr, Nifty gets hammered once again on the downside to reach a low of 21,777
Difference 998 points

May 2024:
3rd May, Nifty makes a surge to hit another record high of 22,794 falling agonisingly close to 22,800
13th May, Nifty falls back sharply to register a low of 21,828
Difference 966 points

27th May, the month was not done yet with Nifty leapfrogging again to touch 23,000 and hit a new lifetime high of 23,110
30th May Within 3 sessions it again retraces sharply to fall all the way back to 22417
Difference 693 points

Jun 2024:
3rd June - On the back of exit poll results Nifty jumps big time to break new all time high heading all the way up to 23338
4th June - Just the next day, on account of election results not being as per pollsters, Nifty falls drastically to hit an intra-day low of 21281
Difference 2057 points

Jul 2024:
19th July - It took less than a week for Nifty to regain back it's high by Jun 10th and since then it was on a one dimensional way up registering a record high of 24,854
25th July - The same story took place yet again albeit after a small interval of time where Nifty got hammered back over 600 points to fall to a low of 24,210
Difference 644 points

Aug 2024:
1st Aug - The recovery was as swift as the blink of an eyelid with Nifty racing ahead to the 25,000 mark reaching a new high of 25,078
5th Aug - There was immediately a massive fall due to rising tensions in Japan on account of Yen carry trade making the index to tank over 1000 points to reach an intra-day low of 23,893
Difference 1185 points

Sep 2024:
27th Sep - Nifty again regained it's lost glory to seek newer pastures hitting the landmark of 26,277.35

After Sep 2024, Nifty has been on a one way downside movement with the falls extending intensely  with first 26,000 being broken followed by 25,000, 24,000, 23,000 and within touching distance of breaking the 22,000 barrier as well in the 5 month period from Oct 2024 to Feb 2025.

Let's plot the downfall of Nifty every month beginning from Oct'24 and extending up to Feb'25 marking a record 5 continuous negative closing periods.

Sep'24 close: 25,810
Oct'24 close: 24,205 - Fall of 1605 points - 6.22%
Nov'24 close: 24,131 - Fall of 74 points - 0.03%
Dec'24 close: 23,644 - Fall of 487 points - 2.02%
Jan'25 close: 23,508 - Fall of 136 points - 0.06%
Feb'25 close: 22,124 - Fall of 1384 points - 5.89%

The total fall from lifetime high of 26,277 registered on 27th Sep 2024 to close of markets on 28th Feb 2025 where it ended at 22,124 happens to be a whopping 4,153 points which in percentage terms leads to a down tick of 15.80%.

Let's now look at the support levels for Nifty and which zones it needs to fiercely protect in order to not capsize much further and create further panic and roughening up investor sentiment.

-> First up is the psychological mark of 22,000. Nifty has hit a low of 22,004 in it's first session of March 2025 but just agonisingly managed to hold the fortress of 22,000 from being breached. However in the next session, 22,000 was breached to slip towards a level of 21,964.60 but however managed to recover closing the day well above 22,000. This range is however in grave threat and it looks like it's just a matter of time before this may be tested yet again.

-> Next up is the mark of 21,800. Incidentally 21,801.45 was the highest point reached by Nifty in the year 2023. It will strongly look towards holding that level and not breaking further to induce plenty of chaos in the system. Around 21,800 levels is also where the Nifty closed on the election day 4th Jun 2024 (21,884.50) after having a bazooka fall and recovering quite a number of points by close when the results were more or less crystallised.

-> After that is the level of 21,281. Nifty nosedived to hit an intra-day low of 21,281.45 on Jun 4th 2024 which was the day when the Lok Sabha election results were announced.

-> Closing on it's heels is the speckle of 21,137 (21,137.20) which happens to be the Nifty low in the entire year of 2024.

-> Again in nearby range happens to be the sacrosanct figure of 21,021 which would be a striking fall of 20% (21,021.85) from recent all time high of 26,277.35 putting the Nifty officially into bear territory.

-> Lastly in the series would be the broader mark of 21,000 which is virtually on the same levels of the bear market territory. If 21,000 happens to be taken out there is no doubt pandemonium will swing to the ultimatum inducing colossal levels of panic. 

There is no hard and fast rule that Nifty cannot fall below 21,000. A 25% fall from the high can even take it below 20,000 levels making hell break loose big time. However it has to happen one by one and for now it's very essential that Nifty holds up and prevents itself from falling below the 21,000 figure. It does however look very bleak that Nifty will be able to regain it's lifetime high in the year 2025 going by the trends at play. Every year since the last many years Nifty has always bounced back to reach new highs. This time however it has it's back against the walls and almost needs to defy odds to go past the whistling number of 26,277.35 in 2025. It's going to be a roller coaster ride and surely it's going to be curious how the fortune swings. At the end of the day, markets are supreme and they will do it's thing.

Friday, January 3, 2025

Nifty 50's 5 year journey from 2020-2024

In the last 5 years, India's benchmark market index the Nifty 50 has had quite a rollercoaster 🎢 ride swinging in all sorts of directions by sky rocketing at times and also nose diving at other times leading to plenty of twists and turns. The volatility especially over the last couple of years has been immense and it's really taken both traders and investors for a ride. From the outset, it would look like the returns have been favourable at large but there have also been moments where it's been tepid and at times almost on a comatose mode.

Let's take a look at some of the numbers in actuality to see how the Nifty has actually performed. On 31st Dec 2019 Nifty closed at 12,168.45 with opening price witnessed on 1st Jan being just on the ball park of 12,200 with 12,202.15 being the exact number. From a starting base of 12,168.45, Nifty reached an all time high of 26,277.35 on 27th Sep 2024 and hit a lowest point of 7,511.10 on 24th Mar 2020 on the back of the news over the Corona Virus outbreak.

There are a number of parameters affecting market performance. Uncertainty is probably the single biggest factor leading to market declines. One pattern which can be observed is that whenever markets have rescinded badly, they have bounced back equally well like a springboard with full force. This is not just over the last 5 years but generally across eternity. The falls have almost universally been really swift but the rises have been relatively slower leading to the popular coinage of the phrase 'Markets go down in elevator but rises through staircase'. But the underlying factor and undermining characteristic take away is that Markets always come back and eventually leap higher.

The last 5 years is a good indicator to understand the phenomenon of markets. There were number of worldwide events which crippled the index for a wee bit of time but it always found a way to get out of the crisis eventually moving higher and bolstering to new all time highs along the way. Let's look at some of the historic events that sabotaged the Nifty pulling it down from it's tracks and how it rebounded time and again.

As per stock market parlance, a fall from recent highs in points is usually associated with the following names

5% Fall - Pullback
10% Fall - Correction
20% Fall - Bear Market
30% Fall - Market Crash
50% Fall - Recession

2020:
The Nifty 50 index had reached a new all time high of 12,430.50 on the 20th Jan 2020 after which the pandemic in the form of Corona Virus took place hammering and tonking the markets almost beyond repair. In a small span of 2 months, the Nifty carted and caved in to fall towards a significant low point of 7511.10 leading to a brutal fall of almost 40% (39.58%). The markets however recovered sharply almost going up 100% first reclaiming the earlier all time high on 9th Nov 2020, then capturing the milestone mark of 13000 on 24th Nov 2020 and then hitting another significant landmark of 14000 on the last day of the year viz 31st Dec 2020.

2021:
Compared to the 'V' shaped recovery witnessed in 2020, the year 2021 was relatively less chaotic. The magical milestone mark of 15,000 was reached for the first time on 5th Feb 2021 catapulting to an unassailable 100% rise from the lows witnessed just 10-11 months back in March 2020. The Nifty hit a new high of 15,431.75 on 16th Feb 2021 after which it saw a consolidation for about 3 months before again regaining a new high on 28th May 2021. The Nifty was teetering along these levels for a while before getting to the landmark of 16,000 for the first time on 3rd Aug 2021 and in the very same month usurped itself to another historic high of 17,000 on 31st Aug 2021. 18,000 also was reached very fast on 11th Oct 2021 and it went on to hit a high of 18,604.45 on 19th Oct before retracing and entering into correction territory on 20th Dec reaching a low of 16,410.20 on the back of re-occurrence of new covid variant in the name of Omicron.

2022:
2022 could be summarised as a pretty weak year for Nifty with no new 1000 mark milestones reached all through the year. In fact it was a year which saw 2 major corrections of over 10% in a pretty short span of time. After the low hit in Dec 2022, markets rallied a bit upto levels of 18,350.95 seen on 18th Jan but couldn't go past it's earlier high of 18,604.45 on 19th Oct 2021. The markets in fact started grinding down breaking the Dec low and touching a new low point of 15,671.45 on 8th Mar during the wake of the Russia - Ukraine war. Just when markets were looking like arresting this horror run claiming back the mark of 18,000 in early April came another rude shock in the form of US Fed Rate hike making the markets tank towards levels of 15,183.40 seen on 17th June 2022. This was the second biggest fall for the Markets by over 18% after the Covid crash in Mar 2020. The Markets however found the resurgence to bounce back like it always does to generate a new life time high of 18,887.6 on 1st Dec. It took Nifty over a year to reclaim it's previous all time high made on 19th Oct 2021 to get it back on 28th Nov 2022. It was a turbulent year but the ending was a saving grace helping Nifty to close in the green for another year running.

2023:
Nifty had starting trouble in 2023 meandering it's way in the early part and then starting to go down with 17,000 being broken resulting in another correction of over 10% on 14th Mar largely due to domestic retail inflation remaining above tolerance level in addendum to the Adani saga pertaining to accusations made by the American firm Hindenburg. The fall however stopped at 16,828.35 at close to 11% from recent highs leading Nifty to stage a recovery once again. 17,000 was captured immediately and then 18,000 also was obtained again within less than a month and half finally paving the way to fresh highs registered on 29th May 2023 with the previous high of 1st Dec 2022 being taken out. Within a month on 28th June came the coveted figure of 19,000 for the first time and very soon on 11th Sep came the monumental mount everest milestone of 20,000. Just shy of 3 months occurred the new landmark of 21,000 on 8th Dec. Nifty marched along to reach a fresh new high of 21,801.45 towards the end of the year. Thus it could be said that 2023 was a year in which the start floundered but the end resulted in a flourish.

2024:
The Nifty began 2024 on a high note reaching the rippling summit of 22,000 on 15th Jan. This was followed by another cherished record of 23,000 hit on 24th May. 3rd Jun saw Nifty reach a peak of 23,338.70 on the back of exit polls giving a unanimous verdict towards BJP winning the Lok Sabha elections with overwhelming majority. The next day 4th Jun witnessed a rout of epic proportions as the actual results didn't meet the pollsters expectation with the Nifty tonking towards a low of 21,281.45 resulting in a cut of 2057.25 points from earlier day high leading to a cut of 9% on a single session which was the biggest ever since the Corona fiasco in March 2020. The Nifty recovered quite a few points on the same day and did a torpedo run regaining all it's lost points and surpassing itself to a new high in less than a week on 10th Jun. The fall and rise which happened so spectacularly swiftly was truly unprecedented. Very soon in the same month came the new landmark of 24,000 on 27th Jun. This did not stop as Nifty had more legs to run with 25,000 being scaled on 1st Aug. There was a small top out here with Nifty falling over 1000 points breaking even 24,000 due to news of unwinding of Yen carry trade in Japan along with recently announced weak US jobs and inflation data. This was however really shortlived as Nifty again continued on it's upsurge after the low of 23,893.70 on 5th Aug. The momentum didn't seem to suppress as another breakthrough of 26,000 was conquered on 24th Sep. Nifty ended up with a personal new best of 26,277.35 on the 27th of Sep. Nifty bottomed out after this with the last quarter being very weak starting with a heavy fall in Oct largely on the back of not up to the mark earnings by major corporates coupled with a huge spree of selling by Financial Institutional Investors (FIIs). There was a fall of almost 2000 points in Oct alone and Nifty eventually hit a low of 23,263.15 on 21st Nov cutting back over 3000 points from it's most recent high of 26,277.35 in Sep. Some recovery was seen in Dec with Nifty getting to 50% retracement levels from the lows but it was eventually sold into with Nifty not even able to reach back the mark of 25,000 let alone 26,000. Nifty finally ended the year well shy below the mark of 24,000 at 23,644.80 to be precise leading to close in the green on a year on year basis for the 9th straight year in a row since 2016.

Summarising briefly on all the 10% plus corrections in Nifty over last 5 years

March 2020 - Nifty hit a life time high of 12,430.50 on 20th Jan 2020 and then fell to a low of 7511.10 on 24th Mar leading to a cut of 4919.40 points taking into Bear Market territory by falling 39.58%. This was mainly due to the Covid pandemic spreading far and wide globally 

December 2021 - Nifty hit a life time high of 18,604.45 on 19th Oct 2021 and then fell to a low of 16,410.20 on 20th Dec leading to a cut of 2194.25 points putting it into correction territory by falling 11.79%. This was largely due to the double risk of re-occurrence of new Covid variant spread along with a spike in global inflation threatening economic recovery

March 2022 - After hitting a lifetime high of 18,604.45 on 19th Oct 2021, Nifty fell below 10% and recovered again beyond 18,000 reaching a recent near time high of 18,350.95 on 18th Jan but it couldn't sustain resulting in a pendulum like fall touching a low point of 15,671.45 on 8th Mar leading to a cut of 2933.00 points putting it back into correction territory by falling 15.77%. This was largely due to the escalation of the Russia Ukraine war.

June 2022 - Nifty again recovered sharply after the deep fall in March reclaiming the 18,000 mark once again hitting a near term top of 18,114.65 on 4th April on the day when the news of the merger between HDFC & HDFC Bank broke out. However it again failed to take back it's previous high and this time fell even more severely to levels of 15,183.40 witnessed on 17th June from the last all time high of 18,604.45 on 19th Oct 2021 leading to a cut from recent highs of 3421.05 putting it almost close to Bear market territory by falling 18.39% from last all time high. This was due to US Fed hiking rates.

March 2023 - After ending 2022 on a high with a new lifetime high touched on 1st Dec 2022 of 18,887.60, the markets again started going downhill in 2023 with a low reached of 16,828.35 on 20th Mar 2023 leading to a cut of 2059.25 points putting it back into correction zone by falling 10.90%. This was largely due to domestic retail inflation going beyond the threshold levels.

November 2024 - After the very recent high of 26,277.35 made on 27th Sep 2024, Nifty started colliding downwards with an extremely weak October month which continued onto November leading to a plummet towards levels of 23,263.15 thus falling by over 3000 points with 3014.20 points being exact making it go back to correction territory in a small time frame of less than 2 months by falling 11.47%. This was largely due to sluggish corporate earnings in addition to record selling by FIIs.

Thus, if one looks at it from a panoramic view, markets undergoes shifts resulting in turbulence of all kinds. Markets can move due to multiple reasons such as Health (Covid 19 pandemic, Second Wave etc), War (Russia vs Ukraine, Iraq war etc), Economy (Interest rate, Inflation, Currency Exchange, Dollar Index etc), Politics (Election results, Policy changes etc), Finance (Corporate Earnings, Company Performance etc), Data (Jobs, Taxes, Unemployment etc), News (Breaking news of Deals/Merger, Scandals & Fraud accusations such as Hindenburg on Adani etc), Competition (Other Avenues like Bitcoin/Commodities, New player in the market making inroads etc), Technology (Newer innovations like Artificial Intelligence, Measures to increase scale/production etc), International (Global Headwinds, Other Markets Cascading effect etc).

Looking at the outlook ahead for Nifty, viewing past data is a reasonable indicator. Many of the events which occurred in the last 5 years were unexpected and uncertain but still Nifty was able to hold it's head high and wade through troubled waters. The upcoming years also may spring plenty of negative surprises for which one has to factor in and be prepared for. One thing for certain is that as long as the world continues to be unpredictable, the markets will replicate the same and lead to corrections time and again in the years to come as well. But, having said that if the economy is able to sustain and grow despite whatever comes it's way and if that's also resonated with robust company earnings and clocking of good performances, one can be rest assured that markets will continue to soar and reach new heights in the years to come. Having seen a swing of close to 20,000 points from the low and high points across the period of 5 years from 2020-2024, anything is possible but on a reasonable estimate, one can expect Nifty to cross the milestone of 30,000 and the Grand Old Index Sensex to touch the 6 figure mark of 100,000 in the next 2-3 years. Without further ado, the golden rule and motto of staying invested holds good with patience eventually bearing fruit and reaping reward in the long run.

Sharing a small synopsis of year on year Nifty trend in addition to overall performance across 5 years.

Thus, if one looks at it, the year on year return for 2021 has been the most productive and the High to Low swing has been most predominant in the year 2020 when Nifty closed to doubled itself after the Covid crisis. From the beginning of 2020 to end of 2024, the Nifty has delivered a whopping return of almost 95% and from the stark lows to the euphoric highs, the returns have been approx 2.5x. Thus, if one probably invested during the Covid lows of Mar'20 and exited in Sep'24 which is a period of 4 and half years, the results suggest a staggering 250%. This table also illustrates that 'Time' is key when entering markets. It's never easy to time the market but if one had the belief to enter and stay invested, the returns that could have been made would be nothing short of astronomical even at an Index level.

Saturday, June 10, 2023

Market Capitalisation - Large, Larger and Largest

There are many determinants when it comes to valuing the size of a company which could be in terms of revenues, profits, cash, foothold or a host of factors but the single biggest contributor happens to be Market Capitalisation or what is loosely termed as M-Cap. Presently, the most valued company in the world happens to be Apple and it's because of the market value that it has ascertained while being traded in the bourses. However it should be noted that there are closely held companies which are not listed in the stock exchanges and for these market capitalisation will not be available or be applicable.

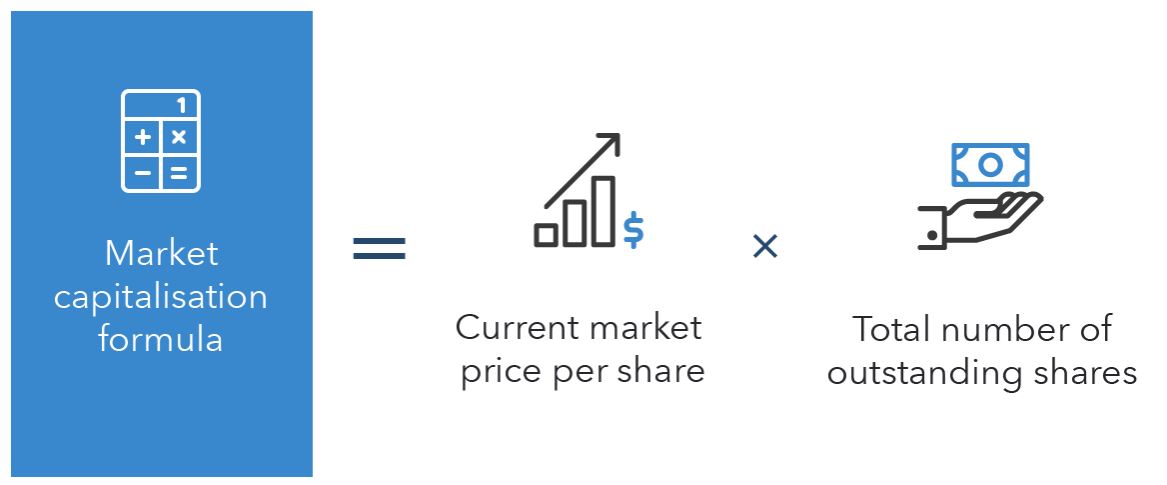
Market Capitalisation in simple terms is the value that is derived at by multiplying the total number of shares of a company by it's present share price value. This is also one of the easiest ways to value the worth of a company in the open market.

In the stock market, weights are assigned to companies based on it's value of Market Capitalisation. Companies are assigned as Large Cap, Mid Cap, Small Cap based on the Market Capitalisation. There are even made up classifications such as Mega Cap, Micro Cap, Nano Cap based on the market size.

Market Size Definition:
The common definition of Market Size is as follows:
Mega Cap: Companies with Market Capitalisation of greater than 200 Billion Dollars (>200Billion$)
Large Cap: Companies with Market Capitalisation of greater than 10 Billion Dollars (>10Billion$ <200Billion$)
Mid Cap: Market Capitalisation of above 2 Billion and lower than 10 Billion Dollars (>2Billion$ < 10Billion$)
Small Cap: Market Capitalisation of up to 2 Billion (>300Million$ <2Billion$)
Micro Cap: Market Capitalisation between 50 Million to 300 Million Dollars (>50Million$ < 300Million$)
Nano Cap: Market Capitalisation below 50 Million Dollars (<50Million$)

From an Indian perspective, stocks are defined in Lakhs and Crores and is as follows:
Mega Cap: Companies with Market Capitalisation greater than 1 Lakh Crores (>1Lakh Crores)
Large Cap: Companies with Market Capitalisation of greater than 20,000 Crores (>20000 Crores <1 Lakh Crores)
Mid Cap: Market Capitalisation of above 5000 Crores and lower than 20,000 Crores (>5000 Crores <20000 Crores)
Small Cap: Market Capitalisation of up to 5000 Crores (>500 Crores <5000 Crores)
Micro Cap: Market Capitalisation between 100 to 500 Crores (>100 Crores <500 Crores)
Nano Cap: Market Capitalisation of less than 100 Crores (<100 Crores)

The above classifications are broadly approximations and may tend to change over a period of time. In India, the broad usage is only with respect to Large, Medium and Small. Very Large can also be equated as Mega and can include companies belonging to the Nifty 50 index such as Reliance, TCS, HDFC Bank, ITC etc. Micro Cap are also termed as Penny stocks.

Stock Type Classification:
Stocks by themselves are also classified into different types based on it's history and the opportunities it derives and provides in the market. Let's look in brief at some of the popular types which gives an idea to the shareholder as to what they are venturing into:

- Blue Chip Stocks: These are usually large cap stocks that are leaders in their particular sector and have a solid history of long term growth performance
- Dividend or Income Stocks: These are stocks with a track record of regularly paying dividends to the shareholders
- Defensive Stocks: These are stocks that tend to be less sensitive to varied market conditions. They are those that do not get swayed much by the volatility prevailing and are the safer bets in times of crisis.
- Growth Stocks: These are stocks that are expected to grow rapidly in the future horizon with respect to earnings and revenue. They are expected to grow at a faster rate compared to the broader market
- Value Stocks: These are stocks that trade at a discount to what a company's performance actually indicates. Hence these are seen as potential value un lockers as they are attractively priced 
- Cyclical Stocks: These are stocks that tend to get affected by the changes in the overall market. They can be seasonal in nature and tend to perform better when market conditions are favorable to it's sector
- Penny Stocks: These are stocks with price trading at a single digit and known to be volatile
- IPO Stocks: These are stocks which get issued through an initial public offering.  They can get listed either at a premium or discount and it's performance is tracked significantly once they are listed
- ESG Stocks: It is expanded as environmental, social and governance stocks and these emphasize mainly on environmental protection, social justice and ethical management practices. These are the stocks that focus on carbon emission and renewable energy measures
- Common or Ordinary Stocks: These stocks entitle shareholders to generated profits and voting rights but have rights to a company's assets in liquidation only after preferred stock shareholders
- Preferred Stocks: These stocks entitle shareholders to generated profits but do not provide voting rights, however they get first preference to a company's assets when a company is dissolved or bankrupt

Market Capitalisation by Country:
In terms of countries with highest Market Capitalisation, the United States rules the roost accounting for more than half of the global market capitalisation of all the countries put together. Let's look below at the top 10 countries ranked by Market Capitalisation.

1) United States of America - 45 Trillion $
2) China - 6.5 Trillion $
3) Japan - 4.4 Trillion $
4) India - 3.1 Trillion $
5) United Kingdom - 3 Trillion $ 
6) France - 2.8 Trillion $
7) Saudi Arabia - 2.6 Trillion $
8) Canada - 2.4 Trillion $
9) Germany - 2.3 Trillion $
10) Switzerland - 2.1 Trillion $

This is the approximate market size of different countries as of June 2023 and may be subject to change. US however does not look to be displaced accounting for a majority of the global M-Cap. India recently pipped the UK to 4th position due to a surge in it's markets. Saudi Arabia is there on the list purely due to just one company - the oil and gas giant Saudi Aramco which rakes in more than 90% of the country's market capitalisation. In Europe, the 3 popular indices tracked include the DAX (Germany), FTSE (UK) and France (CAC).

Market Capitalisation - Largest Company By Country:
It would also be prudent to look at the top company contributing to Market Capitalisation in each of these countries:

1) United States of America - Apple - 2.8 Trillion $
2) China - Tencent - 408 Billion $
3) Japan - Toyota - 202 Billion $
4) India - Reliance - 203 Billion $
5) United Kingdom - Astra Zeneca - 230 Billion $ 
6) France - Louis Vuitton Moet Hennessy - 441 Billion $
7) Saudi Arabia - Saudi Aramco - 2.1 Trillion $
8) Canada - Royal Bank of Canada - 129 Billion $
9) Germany - SAP - 155 Billion $
10) Switzerland - Nestle - 321 Billion $

Thus, if you see Apple alone based on it's Market Capitalisation is far greater than numerous countries combined Market Capitalisation. In US, there are catchy terminologies used to describe a set of tech heavy stocks such as FAANG (Facebook, Apple, Amazon, Netflix, Google), MAAMA (Meta, Apple, Amazon, Microsoft, Alphabet). In France, the top 4 companies all happen to be luxury brands viz LVMH, L'oreal, Hermes and Dior whereas in UK companies from different sectors make up the list such as Astra Zeneca, Shell, HSBC, Unilever, Diageo etc. Japan has auto companies like Toyota, Mitsubishi on its coveted list so does Germany with the likes of Porsche, Mercedes, BWM in it's list of most valued companies.  

Market Capitalisation by Sector:
A sector is that section of the stock market which represents a particular industry. Through this it would be possible to know the outcome as to which company stocks happen to be market leaders within a specified environment. There are broadly 11 sectors that make up the slice of the overall stock market as per the Global Industry Classification Standard. These sectors can include many sub industries within its ambit. Lets look at the 11 different sectors and the company fighting for bragging rights as per value of Market Capitalisation within these sectors on a global scale.

1) Communication Services –  Alphabet (Google) - 1.6 Trillion $
2) Consumer DiscretionaryAmazon - 1.2 Trillion $
3) Consumer StaplesWalmart - 412 Billion $
4) EnergySaudi Aramco - 2.1 Trillion $
5) FinancialsBerkshire Hathaway - 733 Billion $
6) HealthcareUnited Health - 459 Billion $
7) IndustrialsUnited Parcel Services - 143 Billion $
8) Information TechnologyApple - 2.8 Trillion $
9) MaterialsBHP Group - 151 Billion $
10) Real EstatePrologis - 112 Billion $
11) UtilitiesNextera Energy - 149 Billion $

The sectors mentioned above are at the highest parent level and underneath this there are plenty of sub classifications such as for instance Industrials Sector containing Airlines, Airports, Courier Services, Construction and a host of other sub industries. Similarly Financials will include Banks, Insurances, Brokerages etc. One problem with the metric of Market Capitalisation is the fact that it fails to consider diversified businesses. For instance a company like ITC is not only in to Tobacco but also in the hotel business as well as consumer goods segment. Since M-Cap is just derived at by using the number of shares and price of share, there is no way to look at the contribution of market value of each of the sub-sectors. The only way to understand in such cases is by digging deep into the annual report to consider the businesses performed by different segments of a company.

Companies with Highest Market Capitalisation:
Listed below are the companies that possess highest value of Market Capitalisation globally

1) Apple - 2.8 Trillion $
2) Microsoft - 2.4 Trillion $
3) Saudi Aramco - 2.1 Trillion $
4) Alphabet (Google) - 1.6 Trillion $
5) Amazon - 1.2 Trillion $
6) Nvidia - 0.95 Trillion $
7) Tesla - 0.77 Trillion $
8) Berkshire Hathway - 0.73 Trillion $
9) Meta (Facebook) - 0.69 Trillion $
10) TSMC (Taiwan Semiconductor Manufacturing Company) - 0.53 Trillion $

Out of this above list, 8 of the 10 belong to USA with Saudi Aramco and TSMC owned by Saudi Arabia and Taiwan respectively making up the remaining. This list however keeps undergoing a change and can alter often based on the Market Capitalisation value going upwards or dropping. Companies like Visa, United Health, J&J which were earlier part of the top 10 most valued have slipped. Facebook has made a re-entry and at one time slipped even below 20 in the rankings.

There have however been only 8 companies ever to reach the monumental mark of 1 Trillion Dollar Market Capitalisation at anytime during their journey and it includes Apple, Microsoft, Saudi Aramco, Alphabet, Amazon, Facebook, Tesla, Nvidia. Nvidia was the latest entrant to this landmark before falling off a bit. Facebook and Tesla are still a far cry from their highest point reached. Apple is the only company to have touched a value of 3 Trillion Dollars although it has receded from it's peak but however it holds bragging rights in being the first corporation ever to summit the scale of 1Trillion$, 2Trillion$ and 3Trillion$ Market Capitalisation respectively.